Total Pageviews

Thursday, March 22, 2012

LVH, Strain, Ischemia, or What?

A patient calls 911 for chest pain. The discomfort is desribed as a retrosternal pressure. It is worse with coughing and slightly improved with rest. The patient reports a productive cough and subjective fevers.  The patient is awake and alert. Past medical history is significant for COPD, asthma, and tobacco abuse.
BP: 180/100
P: 140
R: 16
Sp02: 92% on room air.

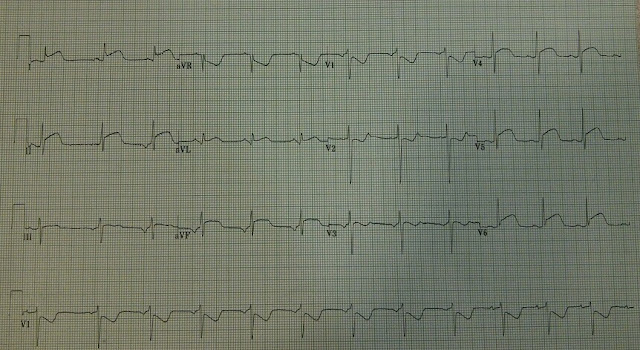
Prehospital 12 lead:


12 lead ECG interpretation:
Sinus tachycardia, left ventricular hypertrophy, diffuse ST segment depression and T wave inversion (inferior, anterior, lateral leads) consistent with strain, possible anterior-lateral ischemia
A baseline sinus tachycardia is present. There are diffuse and prominent ST segment changes. The ECG meets voltage criteria for the diagnosis of LVH. The S wave in V1 plus the R wave in V5/V6 is greater than 35 mm. ST segment depression and T wave inversion is most pronounced in the anterior precordial and lateral leads (V3-V6). This ECG illustrates an ischemic "mimic." Changes associated with high left ventricular voltage, by definition, include ST segment abnormalities. Repolarization abnormalities include ST segment depression, ST segment elevation, and T wave inversion.  The downsloping and depressed ST segment is also consistent with a condition called, "strain." Increases in heart rate can also cause "demand" related ischemia. As the heart rate accelerates, the myocardium's demand for oxygen increases. Tachycardia can therefore induce (and accentuate) ST segment changes such as T wave inversion and ST segment depression.

Left ventricular hypertrophy refers to an increase in heart muscle mass. This change is usually secondary to advanced and uncontrolled hypertension. Simply put, the ventricular muscle increases in order to pump against the increased (hypertension-mediated) afterload. Left ventricular hypertrophy manifests on the ECG as increased R wave amplitude (height). There are several scoring systems for LVH and some have rather poor sensitivity. The definitive diagnosis of LVH is by echocardiogram. The echocardiogram actually measures the thickness of the left ventricle.

General ECG features of LVH:
  • Left axis deviation
  • Repolarization changes (ST depression)
  • Increased QRS amplitude (tall R waves, deep S waves)

Electrocardiographic voltage criteria for LVH:

The STRAIN of hypertension:
Ventricular strain is usually associated with hypertensive heart disease and coronary artery disease. It is a type of ECG pattern seen in ECGs consistent with ventricular hypertrophy. It usually indicates a compensatory response to uncontrolled hypertension and may indicate underlying ischemia. Electrocardiographic criteria for ventricular strain includes:
  • ST depression greater than or equal to 1mm in lateral leads I, aVL and V4-V6
  • Direction of the T wave usually opposite an upright QRS complex
  • Downsloping ST-T segment, rapid upslope
"Strain" of the ST segment:
http://www.medscape.com/viewarticle/504439_3


Case Resolution:
The patient was transported to a local emergency department. The tachycardia resolved following administration of intravenous fluids. Repeat ECGs showed some improvement of the ST segment abnormalities. Given the patient's hypertension and ECG changes, blood was also sent to the lab for cardiac enzyme analysis. Cardiac enzymes remained negative throughout the patient's hospital stay. The patient was diagnosed with bronchitis. The patient was admitted to the hospital for symptom management, blood pressure control, and cardiac stress testing.

EMS Pearls:
  • Fix the rate first! Tachycardia, by itself, increases myocardial oxygen demand and produces ST segment changes
  • Left ventricular hypertrophy causes ST segment changes that resemble ischemic patterns
  • The "strain" pattern, characterized by ST sepression and T wave inverison, is associated with underlying coronary artery disease
  • LVH is a common response to long standing and uncontrolled hypertension

Monday, March 19, 2012

You make the call!


This patient presented to an outside hospital for palpitations following the use of a routine anti-asthma medication. The patient reported chest discomfort and some associated shortness of breath shortly after medication administration. The patient's vital signs remain stable, and her lung sounds were clear. The remainder of the physical examination was unremarkable. An emergency physician obtained a routine ECG. The patient's vital signs were stable and the physical examination was unremarkable.  

The patient was transferred to a tertiary care facility for cardiac catheterization.

1. What's your interpretation of the 12 lead?
2. What are some diagnostic considerations?


12 lead ECG Interpretation
Sinus rhythm, rate approximately 70, diffuse ST segment elevation
There is a baseline sinus rhythm. Widespread ST segment elevation is present in leads I, aVL, II, III, aVF, and in the anterior-lateral precordial leads. The R waves and ST segment depression in leads V1 and V2 are consistent with posterior wall ischemia. The ST segments themselves are mostly convex. The convexity of the ST segment is also suggestive of ischemia. Infarction of the heart's anterior, inferior, lateral, and posterior walls could conceivably produce the diffuse ST segment changes seen in this ECG.

12 lead ECG Discussion and Case Resolution
There are several considerations to bear in mind when looking at diffuse ST segment elevations:
1. Massive myocardial infarction
2. Pericarditis
3. Ventricular wall aneurysm 
4. Coronary vasospasm

The patient's clinical picture (and overall well appearance) is not consistent with the diagnosis of a massive myocardial infarction.

The ST elevations in pericarditis are usually more CONCAVE in appearance. Reciprocal changes are never associated with pericarditis. PR segment depression is also present in pericarditis.

Ventricular wall aneurysm usually presents electrocardiographically with Q waves and diffuse ST segment elevations. There may be a loss of R wave progression across the precordial leads.

There was no lesion amenable to intervention at the time of angiography. The patient's echocardiogram revealed a preserved ejection fraction with some mild, but diffuse, hypokinesis. The patient was diagnosed with coronary artery vasospasm.


Tuesday, March 13, 2012

The Subtlety of STE and its Anatomy

This tracing was discussed at a recent STEMI committee meeting. Its much easier to spot the ischemic changes once the diagnosis is known.....

Subtle STE or artifactual nonsense ?

12 LEAD ECG INTERPRETATION

Baseline sinus rhythm, occasional fusion beats and premature atrial contractions in a bigeminal pattern, ST segment elevation in septal leads

This ECG interpretation is far from obvious. Typical criteria for activation of the cardiac catheterization lab includes at least 2 mm or greater of STE in contiguous precordial leads. Close inspection reveals minimal ST elevation in leads V2 and V3. Clear cut reciprocal changes are not present. The ST segment's shape is far from reassuring: it has a horizonal and ischemic-type appearance in lead V2.

This ECG requires you to bust out the calipers because there is a constant PR interval buried within the premature and fusion beats. At first glance, the irregular rhythm suggests atrial fibrillation. The presence of consistent PR intervals, however, rules out that diagnosis. On most tracings, P waves are best visualized in leads II and V1.

The patient went to the cardiac cath lab; the diagnosis of an acute occlusion of the "ramus." The ramus is simply an intermediate branch of the left coronary artery (LCA)  that arises in between the left anterior descending (LAD) artery and the left circumflex coronary artery. The "ramus" is abbreviated as "Int" in the illustration below.


For those of use who are more visual learners, this picture is furnished courtesy of:
http://www.cardiologysite.com/html/lad.html

The Bottom Line: NTG and ECG

A patient walked into the triage area and reported chest pain, nausea, and "indigestion" for several hours. Initial vitals were stable. After a dose of nitroglycerin, the patient's "stable" vital signs had left the building. Though conscious, a repeat set of vitals (following the NTG dose) was as follows:
BP: 76/40
(Taken mutiple times on multiple extremities)
P: 72
Sp02: 89%
The hypotension resolved after a fluid bolus. An ECG finding (conveniently circled by an alert resident) reveals the answer to the hypotension story..

Right Sided 12 LEAD ECG

12 LEAD ECG INTERPREATION AND DISCUSSION

A baseline sinus rhythm is present. ST segment elevations are seen in the inferior wall leads II, III, and aVF. Expected reciprocal changes in the form of ST segment depressions are seen in leads I and aVL. The right sided chest lead V4 (V4R)  shows ST elevation. STE in V4R indicates right ventricular infarction. These patients are preload dependent. Nitroglycerin is a potent vasodilator. When this drug is administered in the setting of a right ventricular infarction, it can cause significant hypotension. The precipitous drop in blood pressure usually resolved after a fluid bolus.

PEARLS
  • Initiate IV access prior to nitroglycerin administration in patients with inferior wall changes
  • Look for right ventricular myocardial infarction by obtaining right sided chest leads
  • Right ventricuar infarction usually co-exists with inferior wall ischemia
  • STE in II, III, aVF ? Start an IV and reassess folliwing NTG administration!

Monday, March 12, 2012

The Forgotten 12th Lead

A 70 yo patient presented to the ED with chest discomfort, diaphoresis, and nausea. The patient had a history of coronary artery disease and was hemodynamically stable. The patient stated that his retrosternal discomfort was similar his previous "heart attacks." The patient was pain free by the time he was moved into a monitored bed. An initial troponin level sent from triage was negative. Here's the triage EKG:


12 lead EKG interpretation
Sinus rhythm, diffuse ST segment depression, ST segment elevation in lead aVR

Discussion
The ECG, coupled with the patients presentation, is concerning for ischemia. At first glance, this ECG does not meet criteria for activation of the cath lab. A closer look at this ECG reveals cause for concern. There is ST segment elevation present in lead aVR. Often forgotten, overlooked, and otherwise thrown away, lead aVR provides important cluses to underlying cardiovascular disease. ST segment elevation in lead aVR may actually predict acute occlusion of the left main coronary artery. Specifically, STE in aVR that is LESS than STE present in lead V1 is associated with left main occlusion.

References
Gorgels APM, Engelen DJM, Wellens HJJ. Lead aVR a mostly ignored but very valuable lead in clinical electrocardiography. J Am Coll Cardiol. 2001;38:1355-1356
http://content.onlinejacc.org/cgi/content/full/38/5/1355
Mattu A. Lead aVR: importance of the "forgotten 12th lead" in patients with ACS. Medscape Emergency Medicine. 2009. Available at: http://www.medscape.com/viewarticle/589781. Accessed February 2012

Hey! Its me in V3!

This may look like your ordinary inferior wall MI, but the expert ECG clinician will spot another potential indication to bypass the local ED in favor of a cath-capable facility... Don't look too closely!


12 lead ECG Interpretation
Sinus rhythm, inferior wall myocardial infarction

Discussion
Classic inferior wall changes are present in leads II, III, and aVF. STE of greater than or equal to 1mm is consistent with the field impression of ST elevation myocardial infarction. In addition, there's some ST segment depression (reciprocal change) in lead aVL.
Lead V3 also reveals a concerning finding: upsloging ST segment depression. This subtle, but important finding, usually indicates acute occlusion of the proximal LAD. The upsloping ST segments usually appear with tall and upright T waves in the anterior precordial leads.

Learn more about the de Winter ST/T wave complex here:
http://www.ahjonline.com/article/S0002-8703(10)00758-1/fulltext#s0040 

From the bottom up

While you begin your consult to the local PCI/CABG/heart center of excellence, you notice the following tracing spit out from the monitor. The patient is remains hemodynamically stable but states that he's "a bit weak." He's also diaphoretic. Vitals:
BP: 110/60
P: 70
R: 18
Sp02: 96%


Interpretation
Sinus rhythm, first degree AVB, inferior lateral wall MI with posterior wall extension.

Discussion
There's ST elevation of > 1mm in leads II, III, and aVF.  These leads examine the "bottom," or inferior portion of the myocardium. There's also STE present in V6. Clear-cut reciprocal change is present in leads I and aVL. There's badness also going on in V1-V3. The ST depressions, tall R waves, and upright T waves are concerning for posterior wall myocardial infarction. Posterior wall MI rarely occurs in isolation and most commonly accompanies inferior wall ischemia. Leads V1-V3 indirectly reflect what's going on in the back of the heart. Placement of posterior leads on this particular patient would likely reveal ST segment ELEVATION. Also notice the long PR interval in V5 and V6. The right coronary artery (RCA) supplies the sinoatrial node. Myocardial ischemia that occurs in the territory supplied by the RCA can produce heart blocks and conduction disturbances such as the first degree block displayed in this tracing.

Posterior wall MI
-ST segment depression in leads V1-V3
-Tall R waves in V2-V3
-Usually upright T waves

EMS Pearls-
Avoid morphine in patients with massive or large territorial MI's; morphine increases the potential for respiratory depression and pulmonary edema