Total Pageviews

Saturday, December 8, 2012

Simply a Sinus STEMI? No!

]
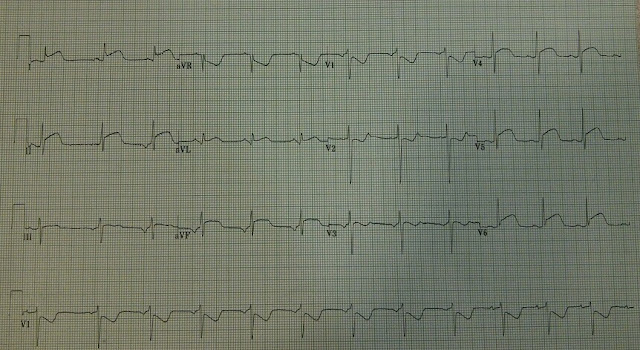
Paramedics respond to a 55 yo female with chest pain and shortness of breath. The patient is alert and hypertensive. The peripheral pulse is irregular.

12 lead ECG: 


12 Lead ECG Interpretation:

The underlying rhythm is most definitely not sinus. A rhythm strip is not included in the LifeNet transmission. Though the first visualized QRS complex in leads I, II, and III APPEARS to be conducted, there is PR interval is excessively long (> 0.2seconds). Furthermore, the P to P intervals appear constant. There is a "p" hiding in the ST segment of the next QRS complex. The constant P to P interval suggests a third degree heart block. ST segment elevation is present in the inferior leads. Reciprocal change is evident in the anterior-septal (V1-V6) and lateral (I, aVL) leads. Recall that ST depression in the septal leads (V1-V2) could indicate posterior involvement. Posterior wall changes generally exhibit tall R waves in leads V1-V3 which are absent in this particular tracing. 


Third degree heart block, inferior wall ST segment myocardial infarction with possible posterior extension. 

12 lead ECG Case Discussion:

This case highlights the importance of a rhythm strip. If there is any question about the presence or absence of an underlying conduction problem, always obtain a rhythm strip. LifeNet provides just a few seconds of rhythm analysis; this interval is occasionally inadequate for proper rhythm determination. Inferior wall changes, coupled with the heart block, suggest injury to the SA node. This patient would benefit from the prophylactic application of pacing pads. Avoid nitrogylcerin in the presence of inferior wall changes and an underlying heart block. 

The "buried P wave" and constant P to P interval: 
\


Saturday, December 1, 2012

Anterior Wall Changes and Abnormal ECG, UNCONFIRMED!

A 60 yo male with a history of CAD, MI, and HTN presents with retrosternal chest discomfort. He is hemodynamically stable. The prehospital provider obtains a 12 lead ECG.


12 lead ECG interpretation: 

A sinus tachycardia is present, and there are plenty of abnormal ST segment changes to point out. First, there is minimal ST segment elevation in V1, V2, and V3 .The ST approaches 2 mm in V2. In addition, the ST segments have a non-concave, or worrisome, appearance in V4. There is T wave inversion in aVL and downsloping ST segments in lead I. Those ST segments resemble the pattern of "ventricular strain."

Sinus tachycardia, ST segment elevation in the anterior precordial leads, anterior and lateral T wave inversion consistent with ischemia.

12 lead ECG case discussion: 

The paramedic scrutinized the anterior ECG changes and declared a, "STEMI." Though the receiving facility determined that the initial prehospital ECG changes did not meet strict STEMI criteria, the paramedic was clearly advocating for the patient's best interest by electing to transport directly to a cardiac interventional center. Previous ECGs from the same patient reflected prior ST segment abnormalities, and the patient wasd admitted to the cardiology service for further testing. Minor, baseline ST segment elevations in precordial leads in addition to high left ventricular voltage can confound the diagnosis of STEMI. The presence of at least 2 mm of elevation plus the identification of reciprocal change (in the form of ST segment depression) makes the diagnosis of STEMI much more likely. Always remember that serial ECGs are extremely important when dealing with concerning or "borderline" presentations.

Wednesday, September 19, 2012

Sinus Tachycardia ?

Providers arrive at the scene of a 5 year old male with chest palpitations. The patient is alert and appears anxious. He is mildly short of breath. Symptoms occured spontaneously and have been present for the last hour. The patient is experiencing associaed nausea. The patient denies LOC, diaphoresis, or recent illness.

BP: 90/palp
P:   200/min, rapid
R:  22 (hyperventilating)
Sp02: Poor waveform

12 Lead ECG

ECG Interpretation and Case Discussion

This patient is clearly experiencing some type of supraventricular tachycardia. Though the QRS complexes are narrow and occur at regular intervals, there is no evidence of an aberrantly (non sinus) conducted p-wave. A close examination of the precordial leads reveals an extra, retrograde "blip" in V1 and V2. Retrograde P's make the diagnosis of a junctional tachycardia more likely. This patient is symptomatic but relatively stable. Appropriate treatment options include:
1) Vagal maneuvers
2) Adenosine 0.1 mg/kg IVP, may repeat at 0.2 mg/kg
3) Synchronized cardioversion 0.5-1 joule/kg

This patient was treated successfully with a rapid administration of adenosine. After a period of observation in the ED that included repeat ECGs, serum electrolytes, and cardiac monitoring, the patient was discharged.

ECG Interpretation

Junctional (supraventricular tachycardia), rate of 200/minute

For rapid, regular, narrow complex rhythms, consider the following:
  • Atrial flutter
  • SVT
  • Sinus tachycardia

Sunday, June 10, 2012

The History of Present (and Past) Illness

EMS responds to the home of a 69 yo male patient. The patient reports retrosternal chest pain x 3 hours. The patient has taken 2 of his own nitroglycerin without relief. The patient reports mild shortness of breath. He denies nausea or loss of consciousness. The  patient is slightly diaphoretic and states, "you know, this feels entirely similar to my previous MI's." The patient has a history of coronary artery disease, HTN, and placement of three metal stents.

Vital signs:
BP: 180/100
P: 90
R: 22
Sp02: 94%

12 Lead ECG:


12 Lead ECG Interpretation and Discussion:

There is a baseline sinus rhythm. The rate is approximately 80 beats per minute. There is ST segment elevation in lead I. In addition, ST segment elevation is present in leads V2-V4. There are no reciprocal changes in the inferior wall leads. There are non specific ST segment changes (flattening) present in leads V5-V6.  The QRS axis is difficult to determine but the slightly positive complex in lead aVF and the positive complex in lead I put the mean vector at about 0 degrees, or within the physiologically "normal" range. (17 degrees according to the all knowing interpretation software..)
Incidentally, the QRS is decreased in amplitude. Low voltage QRS is concerning in the setting of patients who present in extremis or with hypotension. Low voltages can indicate serious underlying conditions such as pericardial effusion and tamponade. The patient is hypertensive and a bit tachypneic (RR>18). Remain vigilant for the development of pulmonary edema.


The distribution of the ST segment elevation suggests an acute infarction of the heart's septal and anterior walls. Lead I STE may indicate some lateral involement as well. Patients with anterior wall STEMI are at risk for the development of dysrhythmia and congestive heart failure. The routine administration of morphine sulfate, contrary to many established protocols, has not been associated with improved patient outcome. Administer aspirin, nitroglycerin, and transport to a facility capable of percutaneous coronary intervention.

As mentioned in previous cases, ST segment elevation in leads aVR or even V1 may be predictive of a left main coronary artery occlusion. The anterior wall injury pattern, as seen in this ECG, may be due to acute occlusion of the left anterior descending artery or one of its branches. It is challenging to reliably identify the culprit lesion; anatomy is always better defined during the cardiac catheterizaton.

Final ECG Interpretation:
Sinus rhythm, rate of 90, anterior wall STEMI. Probable acute lateral wall ischemia  Low voltage QRS.  


Saturday, June 2, 2012

***ACUTE MI SUSPECTED*** Abnormal ECG ***Unconfirmed***

After a mind numbing session of protocol review, your partner asks you to review a 12 lead ECG. The ECG tracing was obtained from a patient who was diaphoretic, hypotensive, and semi-conscious.

What's the underlying rhythm?
What are your treatment priorities?

Rampart, prepare to receive telemetry...

12 Lead ECG:


12 Lead ECG Interpretation and Case Discussion:
Once again, kudos to the ECG interpretation software! The ECG is absolutely, without question, ***ABNORMAL***. It looks like this tracing triggered every single lifenet alert possible. The ECG reveals, simultaneously, "inferior and lateral injury patterns" coupled with "atrial fibrillation" and an "anterior injury pattern."

FIRST, the presence of a wide complex tachycardia is easily recognized. The rhythm is wide and regular which suggests ventricular tachycardia. The ventricular rate is in excess of 200 beats per minute. The combination of a wide complex tachycardia and an unstable patient should always warrants serious consideration of electrical therapy. In this particular case, a biphasic shock of 200 or 300 joules isn't likely to produce the desired result.

Now, the patient's chest hairs are signed and you're left with the same troublesome waveform. Vital signs have not improved. This tracing is classic for a specific type of ventricular tachycardia called "sinusoidal" ventricular tachycardia. This rhythm is characterized by a rapid ventricular rate a regular appearance of the QRS complex. Sinusoidal ventricular tachycardia is often called ventricular flutter. It is typically a pre-arrest rhythm that deteriorates rapidly into the more familiar ventricular fibrillation.

Though typically caused by severe hyperkalemia, ventricular flutter may be medication induced. Sodium channel blocking anti-dysrhythmics and anti-psychotics have been linked to sinusoidal VT. Treatment therefore involves:
  • Rapid administration of IV calcium (stabilizes the myocardium)
  • Empiric treatment for hyperkalemia (consider bicarbonate, albuterol, etc)
  • Defibrillation
  • Treatment of underlying cause (emergent hemodialysis)

Administration of anti-dysrhythmics such as lidocaine are not usually effective and may even precipitate deterioration of the rhythm into ventricular fibrillation.

When confronted with the dreaded sinusoidal ventricular tachycardia, consider the patient's history if at all possible. Patients with known renal disease or complex medical comorbidities may be at risk for hyperkalemia. If local protocols permit, aggressively treat hyperkalemia. Administration of calcium may render the myocardium less resistant to electrical therapy.

The patient's potassium level was measured at over 9 mEQ/L (normal 3.5-5 mEQ/L) .

Final 12 Lead ECG Interpretation:Sinusoidal ventricular tachycardia, ventricular flutter likely secondary to severe hyperkalemia

Friday, May 25, 2012

A Serial Case

An elderly male patient is transported to the emergency department following a syncopal episode. The patient reported feeling lightheaded, and experienced two witnessed syncopal episodes lasting for several minutes. Symptoms were made worse when standing up. The patient denied chest pain and reported some mild dyspnea. The patient had been in his usual state of health. The patient's medical history is significant for a tibial fracture several months prior.

Vitals:
Afebrile
BP: 72/P
P: 100
R: 24
Sp02: 92%, poor waveform, on NRB
Physical exam:

Pt is diaphoretic and alert.
Lungs are clear bilaterally.
The patient's abdomen is soft and non tender.
No evidence of lower extremity edema.

(Prehospital) 12 lead ECG:


Upon arrival at the hospital, large bore IV access was secured. A FAST (Focused Assessment with Sonography for Trauma) exam revealed no obvious free fluid and no obvious pericardial effusion. The abdominal aorta appeared grossly normal. The patient remained alert and responded to a bolus of IV crystalloid. A repeat ECG was obtained following another pre-syncopal event in the emergency department.


12 Lead ECG Interpretation and Discussion

On the repeat ECG, a sinus rhythm is present. The electrical axis is physiologic. Artifact interferes with the tracing in the inferior limb leads. ST segment elevation is present in aVR, V1, and V2. The ST segments appear horizontal in shape. That particular morphology is concerning for ischemia. While some mild ST segment depression is present in lead I, there are no clear cut reciprocal changes. The evolving changes suggest a septal wall myocardial infarction.

Final Interpretation

Sinus tachycardia, septal ST segment elevation myocardial infarction
(WRONG!)

Case Conclusion

The patient was transported emergently to the cardiac catheterization lab. The patient's coronary arteries were CLEAN and without evidence of disease. An emergent echocardiogram showed a severely dilated right ventricle with concurrent diastolic dysfunction. The clean coronary arteries and echocardiograpghic findings combined point to a massive pulmonary embolism as the cause of the patient's symptoms. Another subtle clue to this diagnosis was the hypoxia that persisted with high flow oxygen administration.

Though not all that elevates is a STEMI, field providers should nevertheless focus on identifying worrisome ST segment changes. The patient's initial ECG was somewhat non-specific. Though close inspection can reveal some slight ST segment elevation of less than 1mm in aVR and V1, it certainly did not meet standardized criteria for STEMI. The second ECG, however, represents a clear-cut evolution. ST segments have become more pronounced (elevated) in the septal leads. The increase in elevation combined with the horizontal plateau of the ST segments in leads V1-V2 suggest an evolving myocardial infarction- or an alternative diagnosis.

The patient presented with a syncopal episode and profound hypotension. Any number of emergent medical conditions can present with those complaints. Pulmonary embolism, internal bleeding, and aortic dissection must be considered in the initial assessment of the hypotensive patient. Unfortunately, there are no "classic" electrocardiographic findings associated with a large PE. That said, the following features can be seen in the setting of a pulmonary embolism.

PULMONARY EMBOLISM ECG FINDINGS
  • Sinus tachycardia
  • Right bundle branch block or incomplete right bundle branch block
  • Deep S wave in lead I, Q wave in lead III, and an interveted T wave in lead III (S1, Q3, T3)
  • T wave inversions
  • Right axis deviation
  • ST segment deviation (depression and elevation)
Sinus tachycardia and right bundle branch block may suggest "heart strain." These are electrical manifestations caused by the right ventricle that is pumping against a greatly increased pulmonary resistance.


Thursday, May 24, 2012

aVR Rears its Ugly Elevation

A cardiologist's office calls 911 for an elderly patient who suffered a syncopal episode. The patient presented to the physician's office for a few weeks of bilateral arm pain and fatigue. The patient experienced mild dyspnea on exertion and was undergoing a chemical stress test when he experienced a brief syncopal episode. The patient was pain free at the time of EMS arrival. The patient was awake and alert. Vital signs:
BP: 104/70
P: 100
R: 22/non labored
Sp02: 96%

The cardiologist suggested transport to a facility capable of percutaneous coronary intervention. Why was the cardiologist so concerned (aside from the presence of an elderly patient with syncope in his office)? What's going on with this ECG?

12 lead ECG

12 Lead Interpretation and Discussion

The patient's rhythm is a borderline sinus tachycardia. ST segment elevation is present in leads aVR and V1. Diffuse ST segment elevation is present in the inferior and lateral leads. Though ST segment elevation in lead aVR isn't typically considered a "STEMI," there is sufficient evidence in the emergency cardiology literature that it should be considered as a "STEMI equivalent." ST segment elevation of > 1 mm (or > 0.5 mm in some studies) is associated with obstruction of the left main coronary artery. Furthermore, these patients are more likely to require surgical revascularization (CABG) or experience congestive heart failure. The skilled paramedic will easily recognize the widespread and diffuse ST segment abnormalities. This patient requires evaluation at a facility capable of percutaneous coronary intervention.

Final 12 lead ECG Interpretation

Sinus rhythm, ST segment elevation in leads aVR and V1. Probable acute obstruction of the left main coronary artery. Diffuse ST segment depression in the inferior (II, III, aVF), anterior (V4-V6), and lateral (I, aVL) leads.

Suggested Readings

  • Rokos IC, French WJ, Mattu A et al. Appropriate cath lab activation: optimizing electrocardiogram interpretation and clinical decision making for acute ST elevation myocardial infarction. Am Heart Journ. Dec 2010;160(6):995-1003

  • Barrabes JA, Figueras J, Moure C, et al. Prognostic value of lead aVR in patients with a first non ST segment elevation acute myocardial infarction. Circulation. 2003;108(81):814-819

  • Williamson K, Mattu A, Plautz CU. Electrocardiographic applications of lead aVR. Am J Emerg Med. 2006;24:864-874

"Abnormal ECG" and Bypass of the Closest Facility

So.. would you call this one and activate the cath lab from the prehospital ECG? The patient is a 72 year old female with severe uncontrolled hypertension. She called 911 for mild shortness of breath. Her blood pressure is over 200 mm Hg systolic. The patient is awake, alert, and oriented. The paramedic is bypassing a local facility in favor of the closest cardiac interventional center.

What's your analysis?

12 Lead ECG


12 Lead ECG Interpretation and Discussion

A baseline sinus rhythm is present. There is a significant amount of artifact that interferes with interpretation in the limb leads. A fusion beat is seen in the limb lead tracings. However, there is > 1mm of ST segment elevation in lead III. Lead aVF also has minimal ST segment elevation. Pathologic Q waves are present in contiguous leads (III and aVF). Though an isolated Q wave is common in limb lead III, the presence of Q waves in contiguous inferior leads (III and aVF) suggests ischemia. In addition, ST segment depression is present in the reciprocal leads of I and aVL. This finding further supports the presence of acute injury. ST segment elevations are also seen in leads aVR and V1. As discussed in a previous case, the presence of STE in leads aVR and V1 may predict obstruction of the left main coronary artery. Poor R wave progression is present across the precordial leads V2-V6. This finding  (the loss of R wave amplitude) is consistent with the machine generated diagnosis of "anterior infarct, age undetermined." These findings, when put together, reveal an inferior wall STEMI. This patient is best cared for at a facility capable of percutaneous cardiac intervention.

Final interpretation

Sinus rhythm, inferior wall STEMI. Anterior wall ischemia. Reciprocal changes in the form of ST depression present in the anterior-lateral limb leads.


Monday, May 14, 2012

The Deceptive Ears of a Rabbit

This particular ECG resulted in a great deal of discussion. Though I don't have the actual details of the patient encounter, its clear that the ECG machine, the paramedic student, the preceptor, and the emergency physician all contest the actual interpretation of the following tracing. ECGs like this one represent fantastic learning opportunities. When confronted with a bunch of squiggly lines and conflicting information, it is imperative to stay focused and proceed through the ECG interpretation in a stepwise fashion. Judging from all of the hashmarks, pen marks, and circles, there wasn't any resolution by the time the paramedics had cleaned their stretcher and left for their station!

1) What's the rate?
2) What's the rhythm?
3) Are concerning ST/T segment changes present?
4) Where are my defibrillator / pacer pads?

12 lead ECG


12 lead ECG interpretation and discussion


The ECG tracing reveals a regular rhythm. Before getting distracted by rabbit ears or conduction delays, it is important to discern whether or not a sinus rhythm is present. P waves are occasionally visualized, but there is simply no fixed PR ratio. The absence of a fixed PR suggests that a high grade block is present. Considering the widened QRS, it is likely that the tracing represents a third degree heart block. Further corroborating that interpretation is the relatively fixed R to R interval. Putting this together: wide QRS + fixed R to R + varied PR interval  = third degree heart block. By definition, a right bundle branch block or left bundle branch block CANNOT be diagnosed in the absence of a sinus rhythm.

The ST/T segments are grossly abnormal. The large QS wave present in leads III and aVF suggest a prior inferior wall myocardial infarction. In addition, there is poor R wave progression across the precordial leads. The R wave is still of decreased amplitude in lead V4. Recall that the R wave should transition to a mostly positive deflection by lead V4. There is minimal ST segment elevation in the inferior leads as well. Though this patient may be suffering from acute ischemia, the presence of a third degree block is requires aggressive management and expeditious transport. This rhythm, in the presence of anginal symptoms, warrants chemical or electrical therapy. Transport to an interventional facility, patient stability permitting, is a good strategy.

Fix the rate first!
Final interpretation


Probable third degree heart block, probable inferior wall myocardial infarction, old anterior wall myocardial infarction  


Saturday, May 12, 2012

All that elevates isn't STEMI


Further confounding the already difficult job done by EMTs and paramedics is the idea of falsely positive ST segment elevation. Even when the EMS provider's eyes are focused on the STE prize, there are lots of distractors out there. This ECG was transmitted as a "priority one" STEMI patient. The cath lab was NOT activated from the field.

Of course, providers should ALWAYS err on the side of caution and transport patients with concerning ECG findings to the closest appropriate hospital. That said, this ECG is a bit more reassuring when placed under a bit more intensive scrutiny.

The patient as an otherwise healthy 30 year old male. The patient had no previous medical history and reported constant chest discomfort over the past week. The patient denies nausea, vomiting, shortness of breath, syncope, or other associated symptoms.  Vitals were unremarkable except for a blood pressure of 140/76. The patient appeared non toxic and in no acute distress.

12 lead ECG:


12 Lead ECG and Discussion


There is a baseline sinus bradycardia. Tall R waves are present in the limb leads and in the precordial leads V4 and V5. These tall R waves are most appropriately called, "high left ventricular voltage." Left ventricular hypertrophy is not technically correct since this patient is (1) young and (2) we don't have a formal echocardiogram. High left ventricular voltage may be a physiologic finding in young and otherwise healthy patients. Slight ST segment elevation is present in leads V2 and V3. There is J point elevation in lead II as well. Slight ST segment elevation may also be a physiologic finding- in the ABSENCE of a concerning patient presentation. This particular patient had no concerning medical history and appeared well. Also reassuring is the ABSENCE of reciprocal change.

The shape of the ST segment can also help guide your medical decision making. Pathologic ST segments are typically more horizontal in shape. Convex ST segments are also associated with worsent outcomes. Test for convexity by drawing a line from the J point to the peak of the T wave. If the line superimposes the ST segment or if the T wave appears above the drawn line, the ST segment is classified as convex. Convex shape= NOT reassuring. Broad based and wide ST segments also favor ischemia.

Here is an "ugly" appearing ST segment. No offence intended to the poor ST segment depicted:


Another NOT reassuring ST segment :


Sunday, May 6, 2012

Subtlety and STEMI ?


Providers respond to an elderly male reporting 2 syncopal episodes earlier in the day. Upon arrival, the patient is hypotensive to 80/40. The patient is somnolent but arousable. His speech is intact. The patient responds to an infusion of isotonic crystalloid. The patient denies chest pain, abdominal pain, or vomiting.

The patient denies any medical history except orthopedic surgery several months prior. The patient takes daily aspirin and has no known allergies.

Vitals at the time of initial prehospital 12 lead:
BP: 70/P
P: 82
R: 16
Sp02: 88% on room air

Medics establish a large bore external jugular intravenous line. The patient's mental status improves as does his vital signs following a bolus of isotonic crystalloid.
BP: 110/70
P: 90
R: 16
Sp02: 95% on non re-breather

A 12 lead ECG is obtained:


12 lead ECG interpretation and discussion:A baseline sinus rhythm is present. There is minimal ST segment elevation in V1 and V2. Recall that ST segment elevation of greater than 1-2 millimeters is consistent with the diagnosis of STEMI. There is some ST depression present in the inferior leads II, III, and aVF. There are also ST segment depressions in the anterior and lateral precordial leads. The medics are concerned about acute myocardial infarction and transport to the closest cardiac interventional center. A close inspection of lead aVR reveals minimal < 0.5 mV elevation. Recall that ST elevation in lead aVR may be associated with obstructive disease of the left main coronary artery.

The presentation of syncope and hypotension is particularly ominous. Patients could be suffering from an acute myocardial infarction, aortic dissection, pulmonary embolism, or sepsis, just to name a few potentially concerning conditions. This patient's vitals warrant rapid assessment and transport. The field determination of STEMI is challenging with respect to this case but transport to a cardiac interventional center is an excellent option. Patients who are acutely hypotensive from a myocardial infarction (STEMI) are usually suffering from massive anterior wall ischemia. This ECG shows acute ischemic changes in the septal leads. Changes that occur in conjunction with a massive anterior wall MI include ST elevations in precordial leads V1-V6.

The patient's hypoxia is also alarming. This patient didn't have any known medical conditions. The acute onset of hypoxia and hypotension suggests alternative diagnoses. The hypoxia could be due to poor peripheral perfusion. However, the patient's hypoxia persisted despite adequate fluid boluses. Most patients should saturate close to 100% when on high flow oxygen.  

The patient is diagnoses with a large saddle type pulmonary embolism upon arrival at the receiving facility. Recall that risk factors for pulmonary embolism include:

-Orthopedic surgery
-Immobility
-Recent injury or venous stasis
-Birth control use
-Active cancer

As always, remember that your 12 lead ECG is a valuable tool! Have a low threshold to obtain a 12 lead ECG in patients who report syncope. The initial 12 lead findings can relay valuable information to both paramedics and emergency physicians.

Looking Beyond STEMI

Providers respond to the report of a young patient with syncope. The patient is a young female, well conditioned, with no obvious medical history. The patient states that her resting heart rate is "usually in the 40s-50s." The patient reports mild shortness of breath which has been within the past week. The patient takes no medicines and has no known drug allergies.

Physical examination is remarkable for orthostatic hypotension.

Providers obtain a 12 lead ECG:


12 Lead ECG interpretation and discussion:
The rhythm is baseline sinus at a rate of 90 beats per minute. A first degree atrioventricular block is present. There is evidence of an incomplete (less than 0.12 seconds) right bundle branch block. Lead V1 reveals a slightly prolonged QRS duration. Close inspection of the p wave reveals increased amplitude. There are no clear cut ST-T segment changes suggestive of acute infarction.

Diagnosis is very difficult to achieve in the prehospital setting. However, astute paramedics can spot the "normal" ECG tracings from the abnormal ones. This patient's ECG and physical examination findings are extremely concerning. Hypotension in the setting of:
  • Incomplete right bundle branch block
  • First degree AV block
  • Borderline (relative)  tachycardia

is very concerning. This ECG suggests right heart strain. Right heart strain points to the diagnosis of pulmonary embolism. Though there aren't "classic" ECG findings, the diagnosis of pulmonary embolism is supported by the relative tachycardia and shortness of breath.

The patient is transported to the receiving facility where the diagnosis of a large, saddle-type pulmonary embolism is confirmed.

Monday, April 2, 2012

Ante up!


CASE PRESENTATION

The patient is a 40 yo male reporting a 9/10 pressure in the center of his chest. The patient appears pale and diaphoretic.

Family history is significant for early coronary artery disease. The patient felt well prior to experiencing the "pressure in his chest."

What does the 12 lead ECG show ?
Where is this patient's occlusion ?


12 LEAD ECG INTERPRETATION
Sinus rhtyhm, rate of 60, anterior lateral STEMI
A baseline sinus rhythm is present. ST segment elevation is seen in leads V1-V5. Leads I and aVL also reveal significant > 1 mm elevation of the ST segment. Reciprocal changes in the form of ST segment depression are best visualized in the inferior limb leads III and aVF.

The distribution of ST elevation across most of the precordium suggests obstruction of the left main or left anterior descending artery. The LAD supplies blood to the left ventricule. Diagnonal branches of the left coronary artery supply the lateral wall of the left ventricle. Occlusion of a diagnoal branch corresponds to ST elevation in leads I and aVL.

EMS PEARLS
Complications related to a massive anterior myocardial infarction include:
1. Dysrhythmia (VT/VF)
2. Congestive heart failure

Congestive heart failure may occur when approximately 40% of the LV muscle mass is lost to infarction.

Thursday, March 22, 2012

LVH, Strain, Ischemia, or What?

A patient calls 911 for chest pain. The discomfort is desribed as a retrosternal pressure. It is worse with coughing and slightly improved with rest. The patient reports a productive cough and subjective fevers.  The patient is awake and alert. Past medical history is significant for COPD, asthma, and tobacco abuse.
BP: 180/100
P: 140
R: 16
Sp02: 92% on room air.

Prehospital 12 lead:


12 lead ECG interpretation:
Sinus tachycardia, left ventricular hypertrophy, diffuse ST segment depression and T wave inversion (inferior, anterior, lateral leads) consistent with strain, possible anterior-lateral ischemia
A baseline sinus tachycardia is present. There are diffuse and prominent ST segment changes. The ECG meets voltage criteria for the diagnosis of LVH. The S wave in V1 plus the R wave in V5/V6 is greater than 35 mm. ST segment depression and T wave inversion is most pronounced in the anterior precordial and lateral leads (V3-V6). This ECG illustrates an ischemic "mimic." Changes associated with high left ventricular voltage, by definition, include ST segment abnormalities. Repolarization abnormalities include ST segment depression, ST segment elevation, and T wave inversion.  The downsloping and depressed ST segment is also consistent with a condition called, "strain." Increases in heart rate can also cause "demand" related ischemia. As the heart rate accelerates, the myocardium's demand for oxygen increases. Tachycardia can therefore induce (and accentuate) ST segment changes such as T wave inversion and ST segment depression.

Left ventricular hypertrophy refers to an increase in heart muscle mass. This change is usually secondary to advanced and uncontrolled hypertension. Simply put, the ventricular muscle increases in order to pump against the increased (hypertension-mediated) afterload. Left ventricular hypertrophy manifests on the ECG as increased R wave amplitude (height). There are several scoring systems for LVH and some have rather poor sensitivity. The definitive diagnosis of LVH is by echocardiogram. The echocardiogram actually measures the thickness of the left ventricle.

General ECG features of LVH:
  • Left axis deviation
  • Repolarization changes (ST depression)
  • Increased QRS amplitude (tall R waves, deep S waves)

Electrocardiographic voltage criteria for LVH:

The STRAIN of hypertension:
Ventricular strain is usually associated with hypertensive heart disease and coronary artery disease. It is a type of ECG pattern seen in ECGs consistent with ventricular hypertrophy. It usually indicates a compensatory response to uncontrolled hypertension and may indicate underlying ischemia. Electrocardiographic criteria for ventricular strain includes:
  • ST depression greater than or equal to 1mm in lateral leads I, aVL and V4-V6
  • Direction of the T wave usually opposite an upright QRS complex
  • Downsloping ST-T segment, rapid upslope
"Strain" of the ST segment:
http://www.medscape.com/viewarticle/504439_3


Case Resolution:
The patient was transported to a local emergency department. The tachycardia resolved following administration of intravenous fluids. Repeat ECGs showed some improvement of the ST segment abnormalities. Given the patient's hypertension and ECG changes, blood was also sent to the lab for cardiac enzyme analysis. Cardiac enzymes remained negative throughout the patient's hospital stay. The patient was diagnosed with bronchitis. The patient was admitted to the hospital for symptom management, blood pressure control, and cardiac stress testing.

EMS Pearls:
  • Fix the rate first! Tachycardia, by itself, increases myocardial oxygen demand and produces ST segment changes
  • Left ventricular hypertrophy causes ST segment changes that resemble ischemic patterns
  • The "strain" pattern, characterized by ST sepression and T wave inverison, is associated with underlying coronary artery disease
  • LVH is a common response to long standing and uncontrolled hypertension

Monday, March 19, 2012

You make the call!


This patient presented to an outside hospital for palpitations following the use of a routine anti-asthma medication. The patient reported chest discomfort and some associated shortness of breath shortly after medication administration. The patient's vital signs remain stable, and her lung sounds were clear. The remainder of the physical examination was unremarkable. An emergency physician obtained a routine ECG. The patient's vital signs were stable and the physical examination was unremarkable.  

The patient was transferred to a tertiary care facility for cardiac catheterization.

1. What's your interpretation of the 12 lead?
2. What are some diagnostic considerations?


12 lead ECG Interpretation
Sinus rhythm, rate approximately 70, diffuse ST segment elevation
There is a baseline sinus rhythm. Widespread ST segment elevation is present in leads I, aVL, II, III, aVF, and in the anterior-lateral precordial leads. The R waves and ST segment depression in leads V1 and V2 are consistent with posterior wall ischemia. The ST segments themselves are mostly convex. The convexity of the ST segment is also suggestive of ischemia. Infarction of the heart's anterior, inferior, lateral, and posterior walls could conceivably produce the diffuse ST segment changes seen in this ECG.

12 lead ECG Discussion and Case Resolution
There are several considerations to bear in mind when looking at diffuse ST segment elevations:
1. Massive myocardial infarction
2. Pericarditis
3. Ventricular wall aneurysm 
4. Coronary vasospasm

The patient's clinical picture (and overall well appearance) is not consistent with the diagnosis of a massive myocardial infarction.

The ST elevations in pericarditis are usually more CONCAVE in appearance. Reciprocal changes are never associated with pericarditis. PR segment depression is also present in pericarditis.

Ventricular wall aneurysm usually presents electrocardiographically with Q waves and diffuse ST segment elevations. There may be a loss of R wave progression across the precordial leads.

There was no lesion amenable to intervention at the time of angiography. The patient's echocardiogram revealed a preserved ejection fraction with some mild, but diffuse, hypokinesis. The patient was diagnosed with coronary artery vasospasm.


Tuesday, March 13, 2012

The Subtlety of STE and its Anatomy

This tracing was discussed at a recent STEMI committee meeting. Its much easier to spot the ischemic changes once the diagnosis is known.....

Subtle STE or artifactual nonsense ?

12 LEAD ECG INTERPRETATION

Baseline sinus rhythm, occasional fusion beats and premature atrial contractions in a bigeminal pattern, ST segment elevation in septal leads

This ECG interpretation is far from obvious. Typical criteria for activation of the cardiac catheterization lab includes at least 2 mm or greater of STE in contiguous precordial leads. Close inspection reveals minimal ST elevation in leads V2 and V3. Clear cut reciprocal changes are not present. The ST segment's shape is far from reassuring: it has a horizonal and ischemic-type appearance in lead V2.

This ECG requires you to bust out the calipers because there is a constant PR interval buried within the premature and fusion beats. At first glance, the irregular rhythm suggests atrial fibrillation. The presence of consistent PR intervals, however, rules out that diagnosis. On most tracings, P waves are best visualized in leads II and V1.

The patient went to the cardiac cath lab; the diagnosis of an acute occlusion of the "ramus." The ramus is simply an intermediate branch of the left coronary artery (LCA)  that arises in between the left anterior descending (LAD) artery and the left circumflex coronary artery. The "ramus" is abbreviated as "Int" in the illustration below.


For those of use who are more visual learners, this picture is furnished courtesy of:
http://www.cardiologysite.com/html/lad.html

The Bottom Line: NTG and ECG

A patient walked into the triage area and reported chest pain, nausea, and "indigestion" for several hours. Initial vitals were stable. After a dose of nitroglycerin, the patient's "stable" vital signs had left the building. Though conscious, a repeat set of vitals (following the NTG dose) was as follows:
BP: 76/40
(Taken mutiple times on multiple extremities)
P: 72
Sp02: 89%
The hypotension resolved after a fluid bolus. An ECG finding (conveniently circled by an alert resident) reveals the answer to the hypotension story..

Right Sided 12 LEAD ECG

12 LEAD ECG INTERPREATION AND DISCUSSION

A baseline sinus rhythm is present. ST segment elevations are seen in the inferior wall leads II, III, and aVF. Expected reciprocal changes in the form of ST segment depressions are seen in leads I and aVL. The right sided chest lead V4 (V4R)  shows ST elevation. STE in V4R indicates right ventricular infarction. These patients are preload dependent. Nitroglycerin is a potent vasodilator. When this drug is administered in the setting of a right ventricular infarction, it can cause significant hypotension. The precipitous drop in blood pressure usually resolved after a fluid bolus.

PEARLS
  • Initiate IV access prior to nitroglycerin administration in patients with inferior wall changes
  • Look for right ventricular myocardial infarction by obtaining right sided chest leads
  • Right ventricuar infarction usually co-exists with inferior wall ischemia
  • STE in II, III, aVF ? Start an IV and reassess folliwing NTG administration!

Monday, March 12, 2012

The Forgotten 12th Lead

A 70 yo patient presented to the ED with chest discomfort, diaphoresis, and nausea. The patient had a history of coronary artery disease and was hemodynamically stable. The patient stated that his retrosternal discomfort was similar his previous "heart attacks." The patient was pain free by the time he was moved into a monitored bed. An initial troponin level sent from triage was negative. Here's the triage EKG:


12 lead EKG interpretation
Sinus rhythm, diffuse ST segment depression, ST segment elevation in lead aVR

Discussion
The ECG, coupled with the patients presentation, is concerning for ischemia. At first glance, this ECG does not meet criteria for activation of the cath lab. A closer look at this ECG reveals cause for concern. There is ST segment elevation present in lead aVR. Often forgotten, overlooked, and otherwise thrown away, lead aVR provides important cluses to underlying cardiovascular disease. ST segment elevation in lead aVR may actually predict acute occlusion of the left main coronary artery. Specifically, STE in aVR that is LESS than STE present in lead V1 is associated with left main occlusion.

References
Gorgels APM, Engelen DJM, Wellens HJJ. Lead aVR a mostly ignored but very valuable lead in clinical electrocardiography. J Am Coll Cardiol. 2001;38:1355-1356
http://content.onlinejacc.org/cgi/content/full/38/5/1355
Mattu A. Lead aVR: importance of the "forgotten 12th lead" in patients with ACS. Medscape Emergency Medicine. 2009. Available at: http://www.medscape.com/viewarticle/589781. Accessed February 2012

Hey! Its me in V3!

This may look like your ordinary inferior wall MI, but the expert ECG clinician will spot another potential indication to bypass the local ED in favor of a cath-capable facility... Don't look too closely!


12 lead ECG Interpretation
Sinus rhythm, inferior wall myocardial infarction

Discussion
Classic inferior wall changes are present in leads II, III, and aVF. STE of greater than or equal to 1mm is consistent with the field impression of ST elevation myocardial infarction. In addition, there's some ST segment depression (reciprocal change) in lead aVL.
Lead V3 also reveals a concerning finding: upsloging ST segment depression. This subtle, but important finding, usually indicates acute occlusion of the proximal LAD. The upsloping ST segments usually appear with tall and upright T waves in the anterior precordial leads.

Learn more about the de Winter ST/T wave complex here:
http://www.ahjonline.com/article/S0002-8703(10)00758-1/fulltext#s0040 

From the bottom up

While you begin your consult to the local PCI/CABG/heart center of excellence, you notice the following tracing spit out from the monitor. The patient is remains hemodynamically stable but states that he's "a bit weak." He's also diaphoretic. Vitals:
BP: 110/60
P: 70
R: 18
Sp02: 96%


Interpretation
Sinus rhythm, first degree AVB, inferior lateral wall MI with posterior wall extension.

Discussion
There's ST elevation of > 1mm in leads II, III, and aVF.  These leads examine the "bottom," or inferior portion of the myocardium. There's also STE present in V6. Clear-cut reciprocal change is present in leads I and aVL. There's badness also going on in V1-V3. The ST depressions, tall R waves, and upright T waves are concerning for posterior wall myocardial infarction. Posterior wall MI rarely occurs in isolation and most commonly accompanies inferior wall ischemia. Leads V1-V3 indirectly reflect what's going on in the back of the heart. Placement of posterior leads on this particular patient would likely reveal ST segment ELEVATION. Also notice the long PR interval in V5 and V6. The right coronary artery (RCA) supplies the sinoatrial node. Myocardial ischemia that occurs in the territory supplied by the RCA can produce heart blocks and conduction disturbances such as the first degree block displayed in this tracing.

Posterior wall MI
-ST segment depression in leads V1-V3
-Tall R waves in V2-V3
-Usually upright T waves

EMS Pearls-
Avoid morphine in patients with massive or large territorial MI's; morphine increases the potential for respiratory depression and pulmonary edema